Navigation

    • Register
    • Login
    • Search
    • Categories
    • Recent
    • Tags
    • Popular
    • Users
    • Groups
    • Search

    PT3.3s: demo portal Main Dashboard - vertical scales

    ~~Bugs~~
    3
    6
    3495
    Loading More Posts
    • Oldest to Newest
    • Newest to Oldest
    • Most Votes
    Reply
    • Reply as topic
    Log in to reply
    This topic has been deleted. Only users with topic management privileges can see it.
    • R
      Rohan last edited by

      0_1536829287376_Protop portal - Num BI & Locking activity -  vertical scale.JPG

      tom 1 Reply Last reply Reply Quote 0
      • tom
        tom administrators @Rohan last edited by

        @rohan Is there a question about the vertical scales?

        1 Reply Last reply Reply Quote 0
        • R
          Rohan last edited by

          The right-y scales look wrong.
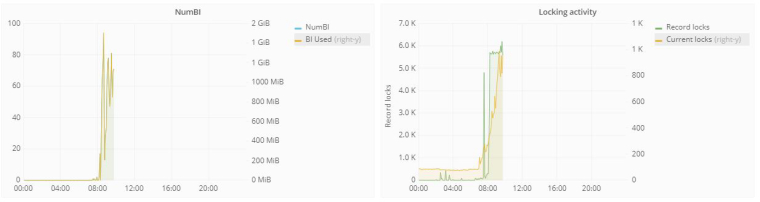
          In the image for Num BI we can see right-y values of: ..600 MiB, 800 MiB, 1000 MiB, 1 GiB, 1 GiB, 2 GiB
          In the image for Locking activity we can see right-y values of: ....400, 600, 800, 1 K, 1K

          1 Reply Last reply Reply Quote 0
          • tom
            tom administrators last edited by

            That's an unfortunate rounding problem in the Grafana libraries. I don't think we can fix it ourselves.

            1 Reply Last reply Reply Quote 0
            • Rob Fitzpatrick
              Rob Fitzpatrick last edited by

              I assume this is a linear scale, so the right-Y labels should be read in ascending order as:
              NumBI: ..., 600, 800, 1200, 1400, 1600
              Locking activity: ..., 600, 800, 1000, 1200

              Correct?

              tom 1 Reply Last reply Reply Quote 0
              • tom
                tom administrators @Rob Fitzpatrick last edited by

                @rob-fitzpatrick Yes, that is correct.

                1 Reply Last reply Reply Quote 0
                • First post
                  Last post